JOLT Cathodoluminescence Detector

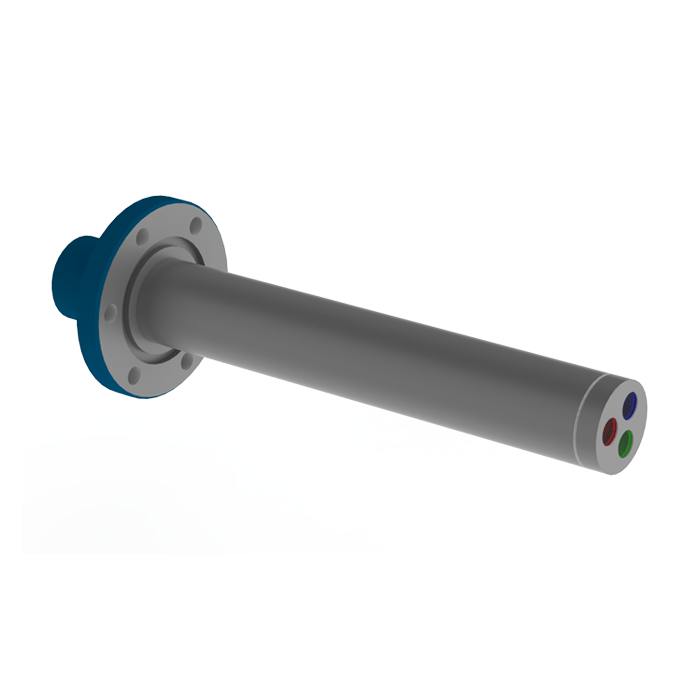
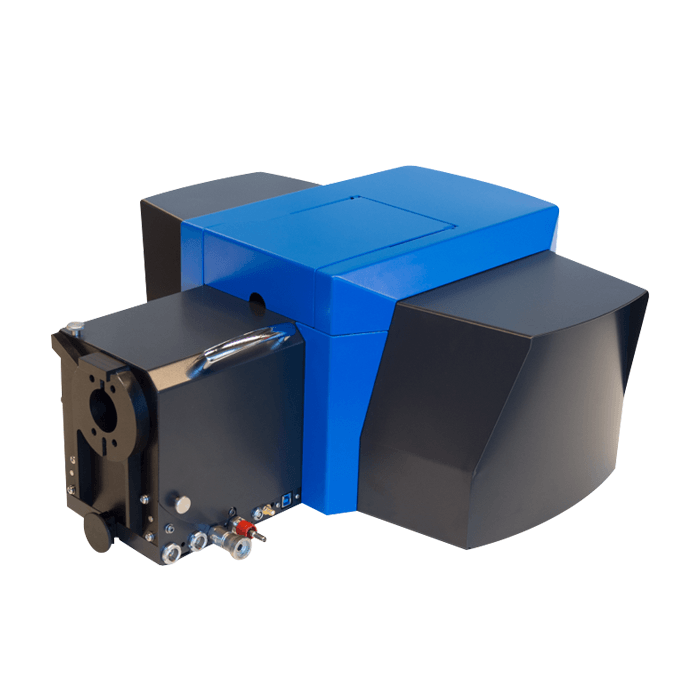
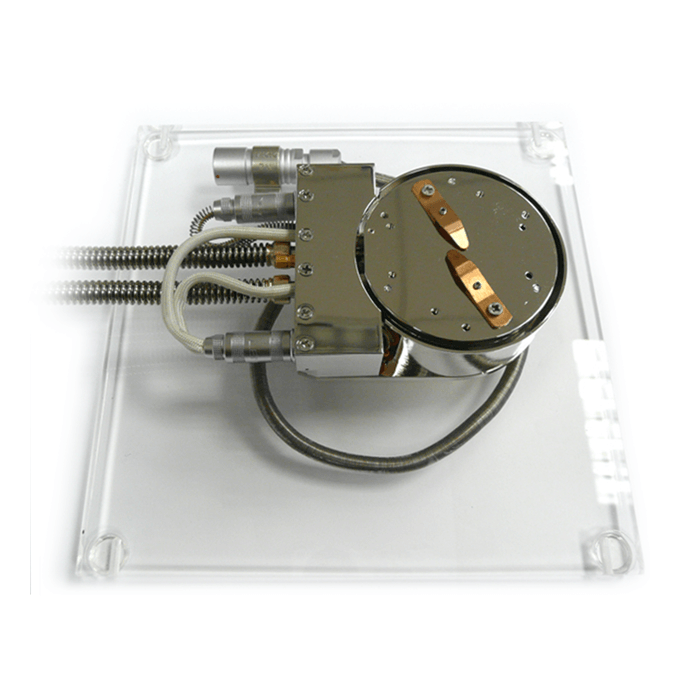
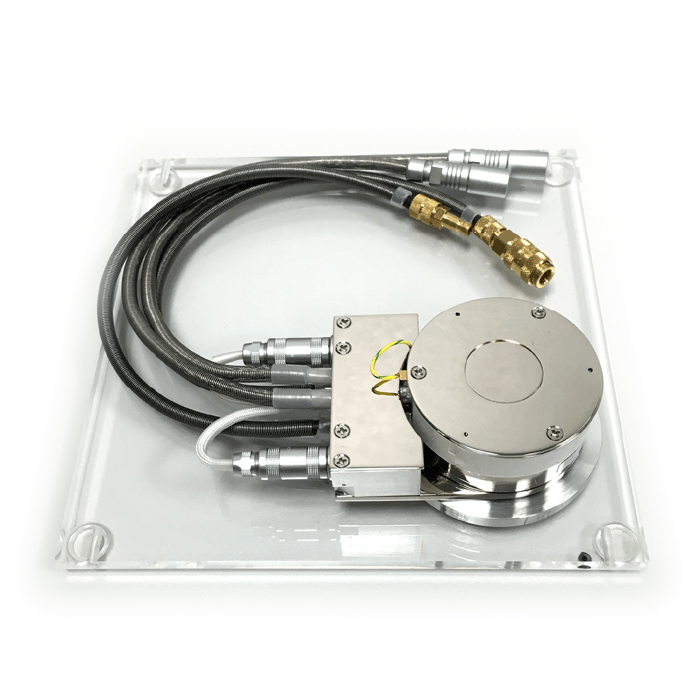
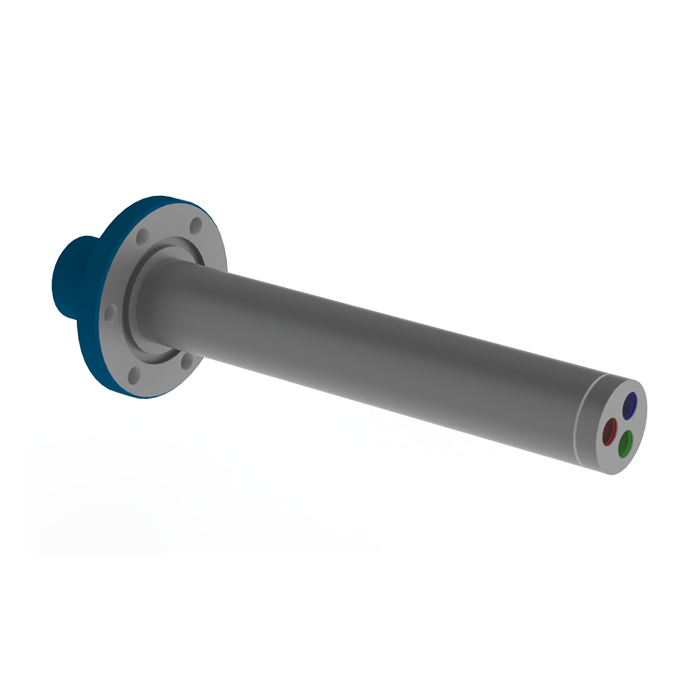
JOLT is a budget-friendly and easy-to-use CL detector, which can be mounted on any SEM via an EDS port

Available in two variations, panchromatic and RGB (colour).

  • Key Features

    • Affordable and easy-to-use CL detection solution - Panchromatic CL detection or RGB (colour) CL detection
    • Compatible with all SEM models  – With an EDS port
    • Easy to use – No alignments & no moving parts
    • Easy to integrate - Works in combination with other detectors using your SEM interface
    • Large Field of view – Several millimetres

CL allows you to rapidly obtain micro and nanoscale insights into materials. Using the Jolt 2.0 you can map the emitted CL intensity to reveal properties such as crystal growth, zonation, deformation and defect structures. You can also measure the CL emission of bulk materials such as semiconductors and rare-earth doped materials. 

The latest version of Jolt mounts to your existing SEM via and EDS port. It integrates with your existing SEM interface providing seamless operation and allows you to correlate CL data with other channels such as BSE, EDS, EBSD etc. providing even deeper insights into your materials. 

If you are interested in spectral CL, you should refer to the Delmic SPARC

  • JOLT 2.0 Overview

    Run time – 1:51 min

    This short video provides a brief overview of the Delmic Jolt and its capabilities and applications.

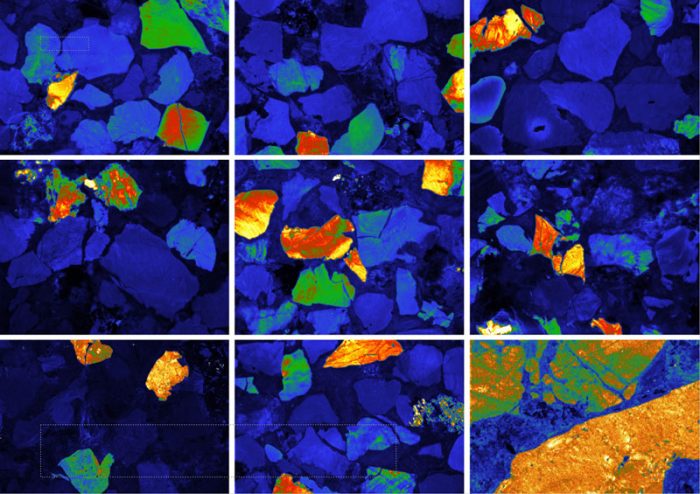
  • Large area CL map of zircon grains

    Direct Colour CL Imaging

    Reveal hidden details in semiconductors, geological samples, and more, as subtle variations in composition and structure are vividly displayed
    through distinct color palettes. From mapping defects and dopants to identifying mineral phases and growth patterns, color filtering enables
    deeper insights into your material.

    Image caption – Reveal hidden details in semiconductors, geological samples, and more, as subtle variations in composition and structure are vividly displayed through distinct color palettes. From mapping defects and dopants to identifying mineral phases and growth patterns, color filtering enables deeper insights into your material.

  • Combination image, parallel BSE and CL imaging

    Correlative CL Imaging

    The ability to directly detect CL using your SEM interface allows you to collect other signals such as EDS, BSE etc. This allows you to gain more detailed insights into your materials by correlating CL data with other signals.

    Image caption – Parallel acquisition of BSE (left) and CL (right) from zircon grains from the Old Hickory Placer Deposit (Virginia, USA). The BSE image is captured simultaneously with the JOLT’s CL signal using an ETD detector at zero bias voltage. Sample courtesy Ryan McAleer, USGS.

  • All
  • AFM/SPM/SNOM
  • Automated Mineralogy
  • CL
  • CLEM
  • EBSD
  • EDS
  • Electron Beam Lithography (EBL)
  • Electron Microscopy
  • Fabrication
  • FIB
  • Hyperspectral
  • In situ
  • Micro XRF
  • Microscopy
  • Raman
  • SEM
  • Spectroscopy
  • TEM
  • Thermal Probe Lithography
  • WDS