What is FLECT?
How does FLECT Work?
FLECT Analysis Examples
Example 1 – Equivalence to PET Imaging
Example 2 – Longitudinal Study Demonstrating the Potential of FLECT
Example 3 – Absolute Calibration Capability of FLECT
Summary
What is FLECT?
While PET (Positron Emission Tomography) is considered the gold standard for molecular preclinical imaging, for many it has been considered out of reach due to the requirement for time-sensitive nuclear PET isotopes, specialised laboratory infrastructure and licencing and expensive scanners. For laboratories, especially those looking to add molecular imaging to their translational research capabilities, FLECT (Fluorescence Emission Computed Tomography) becomes a viable alternative producing equivalent results.
FLECT is an optical molecular imaging modality that produces data equivalent to PET (Positron Emission Tomography) without the need for nuclear PET isotopes. Requiring only fluorescent contrast agents, FLECT is a viable alternative to PET for labs looking for improved translational research capabilities. It is very different to (and complimentary) to the traditional 2D optical systems in abundance in preclinical imaging.
How does FLECT Work?
FLECT technology employs a ring of optical detectors rather than a camera in a configuration similar to that of a traditional PET scanner. These collimated detectors measure the fluorescence (from probes) coming out of the animal generated by a laser as opposed to the gamma rays on a PET or SPECT system. This gantry then rotates around the animal and along the axis.
However, unlike gamma rays which pass through tissue with little to no deviation, visible and near infrared light are highly scattered by the tissue before emanating from the surface of the animal. To calculate and reconstruct the source of the fluorescence (computed tomography), a predictive calculation of the light propagation in the tissue is used. This approach combines the so called Forward Model of Light Propagation in tissue with a “finite difference” inverse solution to the Radiative Transport Equation.
FLECT utilises three measurements to do this:
- The tomography (shape) of the animal to calculate path lengths
- The optical properties of tissue (estimated from the segmented CT data)
- The fluorescence as measured by the collimated detectors.
FLECT Analysis Examples
Example 1 – Equivalence to PET Imaging
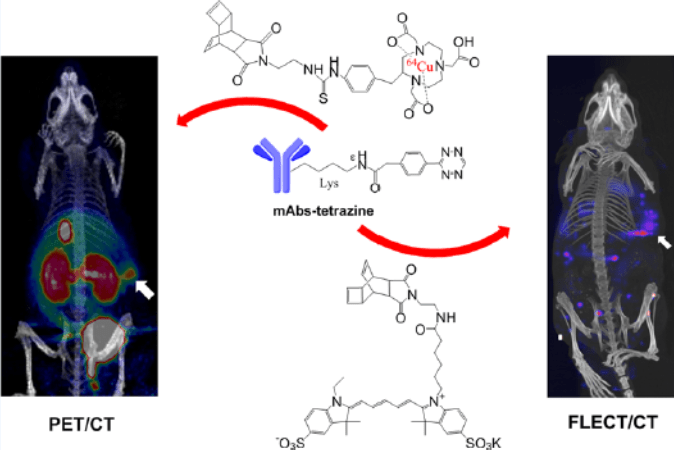
As stated earlier, FLECT is a quantitative viable alternative to PET imaging in many instances. It has been demonstrated that it can be calibrated to provide a result in percentage of injected dose, similar to that of PET. Below is shown a comparison of PET and FLECT imaging in the development of a targeted probe to VEGF. Bevacizumab was labelled alternatively with Cu64 (PET) or Cy5 (FLECT) to target HCT 116 colorectal tumour, and the same animal imaged at a close interval.
Example 2 – Longitudinal Study Demonstrating the Potential of FLECT
The TriFoil InSyte FLECT-CT can produce relative quantitative estimates of fluorescence (R2=0.9985) with a spatial resolution of approximately 3mm and a sensitivity in the picomole to femtomole range. In the example below of a longitudinal study of metastatic colorectal cancer in Swiss nude mice, an orthotopic xenograft of HCT116 Luc2 cells were labelled with IntegriSense 680 (100 uL, 2nmol IV) and imaged 24h post injection over a 25-day period with therapeutic intervention on Day 14. The FLECT-CT is used to track the development of metastasis both pre and post treatment. The graph below shows a reduction in the number of metastasis from the treatment of the tumour and the subsequent recovery and regrowth.
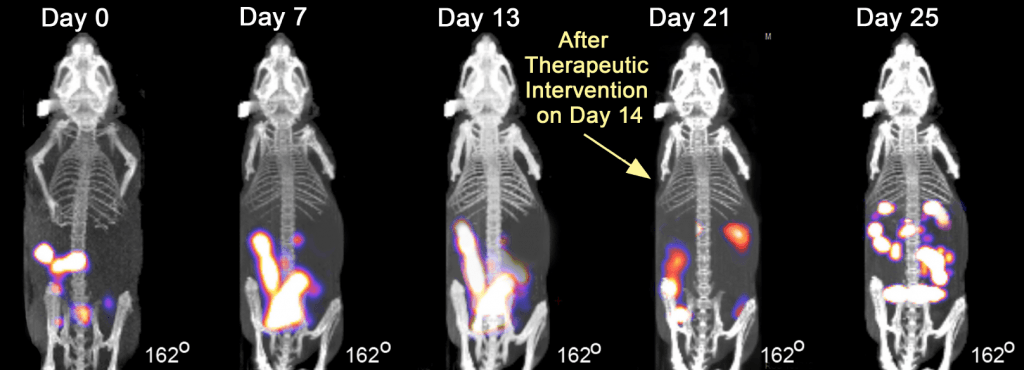
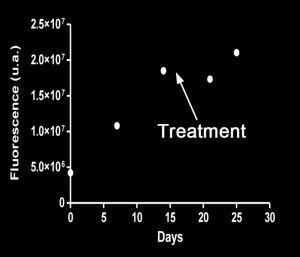
Images from National Center for Scientific Research (CNRS), France and Dr. Alex Klose, Columbia University, NY, USA.
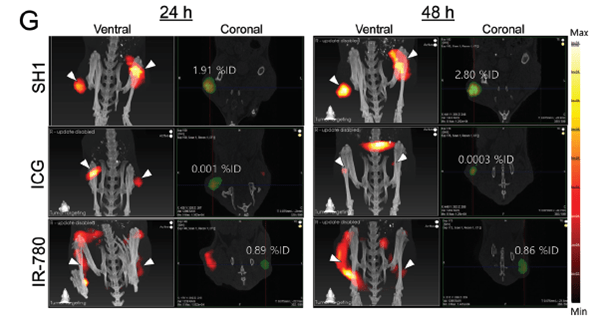
Example 3 – Absolute Calibration Capability of FLECT
The example below demonstrates the capability of the FLECT to provide calibrated data as a percentage of injected dose (%ID). The biodistribution and accumulation of a near-infrared (NIR) fluorescent tumour targeting agent (SH1) in subcutaneous lung carcinoma tumours was assessed over a 48h time period and compared to ICG and IR-780, both commonly used NIR fluorescent agents. By using FLECT/CT, the authors were able to compare the fluorescent agents by performing quantitation at each time point. Using the 3D fluorescence data, the SH1 probe was calculated to have a 2-fold increase in %ID compared to IR-780 24h post injection and a 3-fold increase in %ID after 48h.
Summary
FLECT has been shown to be a viable alternative to PET in preclinical imaging. With the ability to produce imaging of equivalent resolution and sensitivity as PET, which is considered to be the gold standard in medical imaging, FLECT comes into its own using only fluorescent contrast agents, which are cheaper and logistically simpler to deal with when compared to nuclear PET isotopes. The Trifoil InSyte FLECT systems are more affordable to purchase and run, as well as being more compact making them easier to integrate into your laboratory workflow. This brings the potential of preclinical nuclear imaging into the reach of more medical research laboratories.