
Introduction
Micro-computed tomography (micro-CT) has proven to be a valuable tool for non-destructive characterisation of the internal structure of samples. Although micro-CT is a great technology for studying morphological parameters such as porosity, volume fraction, orientation or for revealing defects in manufactured components, it sometimes fails to detect and identify different phases or elements inside these samples, which can be an issue when there is no prior knowledge of the materials present. One example of this is differentiation among carbon-based materials like plastics, polymers and rubber. The principles fundamental of x-ray imaging make it challenging to determine contrast between such materials with conventional CT scanning alone.
This application note successfully demonstrates how TESCAN Spectral CT can be used to increase contrast in extremely low-attenuating materials, in this instance LEGO® bricks.
Increased Contrast with TESCAN Spectral CT Imaging
Contrast in micro-CT scans is based on differences in attenuation of the materials in a sample. This is a direct function of the materials density and is mainly affected by the atomic number. Lego bricks are made from polymers, which are carbon based materials and that are difficult to distinguish using conventional micro-CT analysis methods.
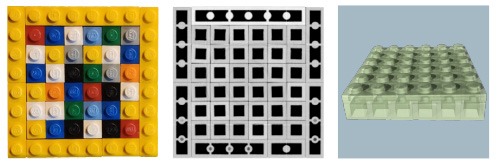
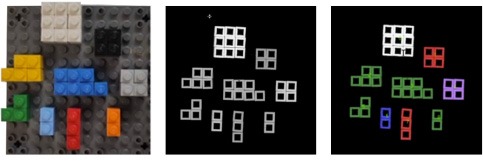
Figure 1 shows a typical micro-CT slice of the sample, produced on the TESCAN UniTOM XL in conventional micro-CT mode. The sample was scanned at a voxel size of 50 µm, with an accelerating voltage of 160 kV, in 2 minutes.
Conventional micro-CT can generate a volumetric dataset which has information about material thickness, volume, sample size and orientation. However, all LEGO bricks have nearly the same grey value, and CT alone provides no information about their colour or composition, whatsoever.
Using the PolyDET II detector and TESCAN Spectral CT we can observe the full attenuation spectrum caused by the interaction between the polychromatic x-ray beam and the samples. The PolyDET II detector counts every photon that hits a pixel and measures the energy of each photon. This result is a spectrum that covers energies between 20 and 160 keV. All this information is captured in one single CT scan.
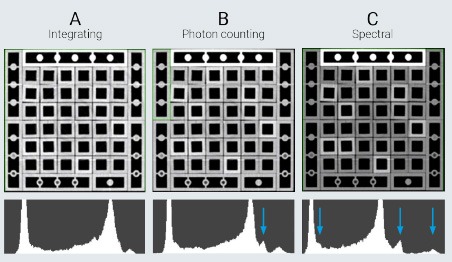
In figure 2, the clear advantages of spectral CT for increasing the contrast in low attenuation materials become obvious. Figure 2a shows the image of a conventional micro-CT scanner, typically using an integrating, indirect detector. That means that all x-ray photons are converted into visual light before they are detected, but then all spectral information is lost. Furthermore, high-energy photons produce a greater signal, causing the low-energy photons, which are the most important for contrast in low attenuating materials, to contribute less to the imaging process. Using spectral CT, we can change how much each photon is weighted and increase the contrast. In figure 2b, each photon is weighted equally, as would be the result of using a standard photon counting detector. This already significantly improves the contrast. When giving low-energy x-ray photons more prominence – something that is only possible using a true spectral CT detector – contrast is optimised, revealing clear differentiation between different types of plastic (figure 2c).
Material Classification and Identification using TESCAN Spectral CT
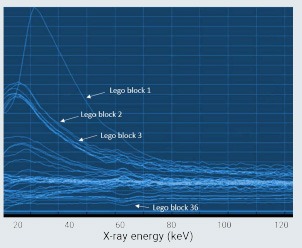
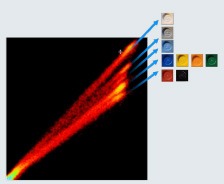
Beyond simply increasing contrast, spectral CT shows each voxel in a spectral dataset, with the full X-ray attenuation spectrum resulting from the interaction between X-rays and the sample at that specific location. Where the overall attenuation measured with conventional CT shows hardly any contrast, looking at full spectral data shows clear differences between the different LEGO bricks. Figure 3 shows the spectra of each individual brick, revealing several overall shapes and indicating different classes of materials.
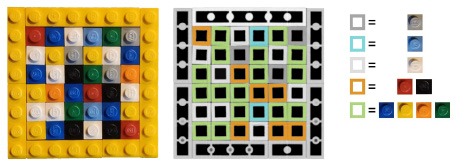
Comparing spectra provides a good visual differentiation between different materials, however it is not always straightforward to get a perfect separation. Using TESCAN Spectral Suite™, it is possible to automatically match the measured spectra with a reference database of individually scanned LEGO bricks. To build this reference database, groups of bricks of similar color were scanned using spectral CT, and their attenuation curves were saved as reference for specific material classes. In figure 4, five different classes of bricks can be identified. Although not always perfect, comparing spectra is a huge improvement for classifying materials versus using conventional micro-CT where such distinction is simply not possible.
After building this reference dataset, TESCAN Spectral Suite™ was used to automatically classify the bricks in our square sample. Without further user intervention, Spectral Suite assigns a class to each of the bricks, thus identifying to which material class each brick corresponds.
Another intuitive way to visualise and analyse spectral data can be found in multi-energy histograms. Such a histogram plots the attenuation value of a material in a certain energy range to the attenuation value of that material in another energy range. In this visualisation, all voxels that belong to a certain material are plotted on a straight line. The position on the line depends on the material’s thickness (in radiography) or density (in CT scans). Figure 6 shows the dual energy histogram of the LEGO brick dataset, clearly indicating the 5 different material classes in a visual and intuitive way. Just like the automatic spectral matching, this dual energy histogram can be used to segment datasets in different classes, by separating the different lines or clusters in the dataset. By doing so, the voxels corresponding to that elemental composition are highlighted and can be added to a class. TESCAN Spectral Suite™ then can use that input data to perform a complete segmentation of the dataset in nine classes or perform the same on different datasets with similar materials. This result proves that spectral CT has the unique capability of providing contrast based on very subtle differences in elemental composition, which is impossible using conventional micro-CT scanning.
K-edge Detection – Identification of Unknown Materials
Looking at figure 1, one thing that stands out is the long horizontal brick at the top of the image. Unlike all the other bricks in the dataset, this one stands out by having a much higher grey value in a conventional micro-CT image. As stated in the introduction, based on this conventional image we can conclude that the average atomic number of the materials in that brick is significantly higher than that of the other bricks in the sample. Unfortunately, that is all that can be concluded with conventional micro-CT. Analysing the spectrum with spectral CT, however, makes it possible to get an absolute identification of the main atomic number in that area of the sample, without any prior information, based on k-edge detection.
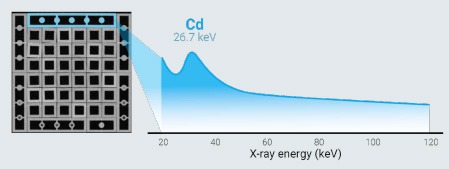
To explain k-edge detection, we need to take a step back to the essentials of micro-CT imaging. In general, X-ray attenuation decreases when the x-ray energy increases. This X-ray attenuation is primarily caused by photoelectric absorption, where the incident X-ray photon is completely stopped by knocking an electron out of one of the orbital shells of an atom in the sample. If X-ray energy increases, there is less chance of such an interaction, and X-ray photons completely pass through the atoms of the sample. However, if the X-ray energy is high enough to overcome the binding energy of electrons closer to the atom’s core, a sudden increase in attenuation is observed, known as a k-edge.
In the LEGO dataset, the spectrum of the brighter long brick can be analysed, showing a clear attenuation peak at 26.7 keV (Figure 3), indicating that this material contains cadmium. Indeed, the occurrence of this carcinogenic metal indicates that this particular block is at least 40 years old. Until the 1980’s, cadmium was used as a colouring agent for yellow and red LEGO bricks, luckily well encapsulated in the plastic so there is no real threat to public health.
Outlook
In this study, true contrast was provided among different coloured LEGO bricks, a surrogate for polymers with very similar compositions, by using TESCAN Spectral CT imaging. Where conventional micro-CT lacks the ability to differentiate between similar materials, TESCAN Spectral CT tackles this by using the complete spectrum of each individual pixel or voxel, taking full advantage of the relationship between X-ray energy and attenuation.
Beyond simply increasing contrast, the analysis of spectral CT data can be used to differentiate, group and even identify different components. The workflow illustrated in this application note shows the potential for spectral CT scanning and can easily be applied to other samples for which contrast in conventional micro-CT is very low. Differentiation between plastics or polymers holds importance for fields such as waste recycling, manufacturing of plastic components and the tyre industry.