
by Dr. Cameron Chai1, Dr. Kamran Khajehpour1 and Dr. Toon Coenen2
1. AXT PTY LTD, 2. DELMIC B.V.
Introduction
Cathodoluminescence (CL) is an increasingly popular technique that provides information about light-matter interactions at the nanoscale. CL looks at the light (photons) emitted by a sample when subjected to bombardment with an electron beam. CL can provide information about the composition, optoelectronic properties and where there is a relationship between these properties, the morphology and microstructure.
Applications of Cathodoluminescence
It has been applied to fields such as semiconductors, insulators, photovoltaics, chemical sensors, plasmonics, quantum cryptography, LED lights, ceramics, gemstones, minerals and glasses to generate a better understanding of the structure of these materials at the nanometer scale.
Cathodoluminescence Imaging Modes
Traditionally, in-house developed systems have been the main way for researchers to collect CL data, which has limited CL’s more widespread adoption. Since the release of the DELMIC SPARC CL detection system, the number of publications and conference talks on CL has significantly increased. The DELMIC SPARC is the most versatile and featureful CL detection system available allowing users to obtain CL signals in a variety of modalities such as:
- Intensity mapping
- Hyperspectral CL imaging
- Angle-resolved cathodoluminescence
- Polarisation filtered cathodoluminescence
- Time-resolved cathodoluminescence
- Energy-Momentum imaging
We will briefly look at these modalities in the following sections.
Intensity Mapping
Intensity mapping is the fastest and simplest way to analyse materials using CL contrast. This technique records intensity at every beam position. Two modes of intensity mapping are possible:
- Panchromatic imaging – The CL signal is averaged over all wavelengths/colours that fall within specific detection ranges
- Colour filtered CL mapping – Uses a bandpass filter
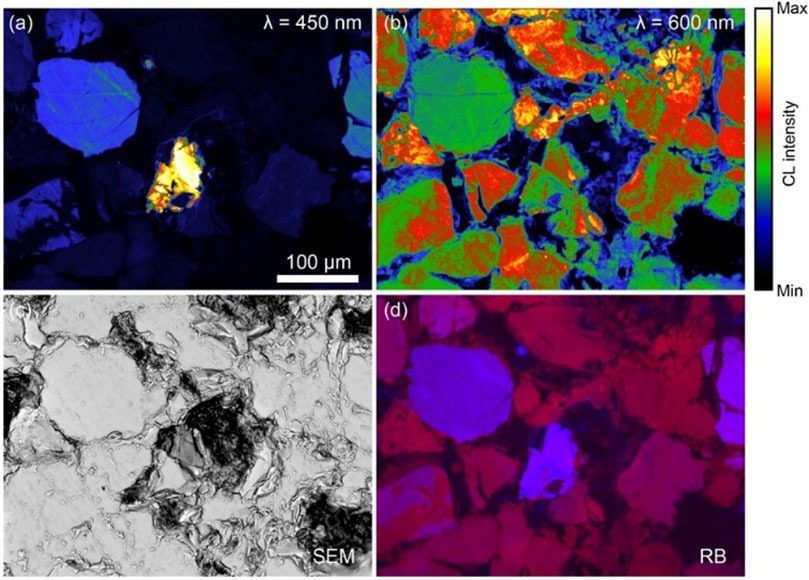
The intensity mapping mode is popular amongst geologist, as the cathodoluminescence emission from a rock can give insights into crystal growth, zonation, cementation, replacement, deformation, provenance, trace elements, and defect structures. This can be used to fingerprint rocks and reveal interesting spatial textures on a submicron scale. CL is often combined with other analytical tools such as SIMS, BSE, EDS, WDS and microCT to provide a more complete understanding of all relevant rock/mineral properties.
DELMIC have recently we have added an automated tiling feature that allows users to analyse large areas by stitching together multiple images.
Hyperspectral Cathodoluminescence Imaging
The CL emission from a material is typically made up of numerous different wavelengths. These individual wavelengths are dictated by factors such as material composition, crystalline structure, configuration and geometry.
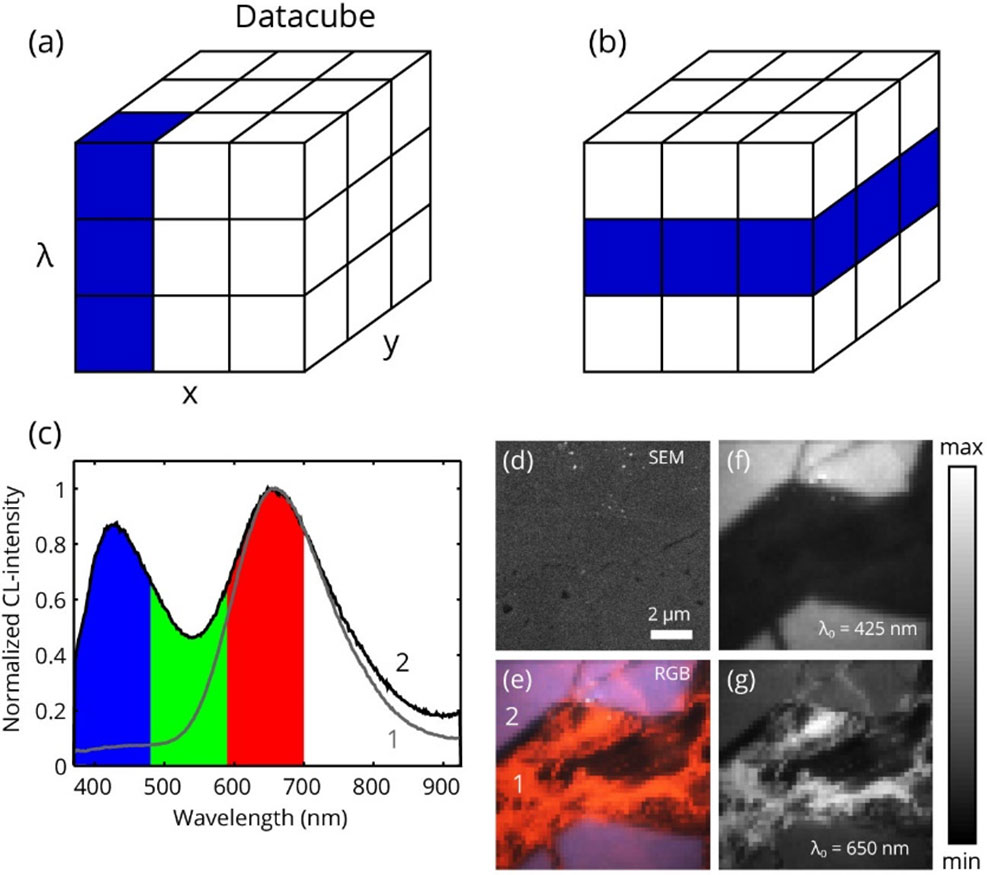
Hyperspectral CL imaging enables the user to separate out these various wavelengths in the UV/Vis/IR range and has been the most widely used CL technique. By combining the spectral sensitivity with the high spatial resolution of the cathodoluminescence imaging technique, subtle changes in the output spectrum, defect luminescence, composition and microstructure can be investigated. This can be used for fundamental studies of the physical and chemical processes of ceramics, dielectrics and compound semiconductors in many different fields such as LEDs, photo-sensors, photonic materials, solid state lasers, etc.
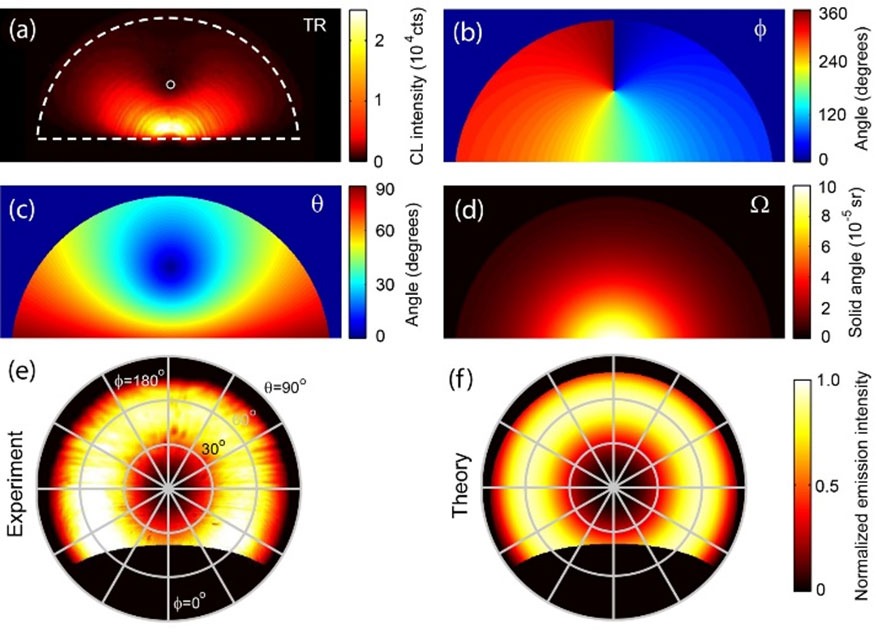
Angle-Resolved Cathodoluminescence Imaging
The DELMIC SPARC was the first commercially available system to offer this analysis mode. It relies on the characterisation of the light wave vector coming from your material which describes the momentum and propagation direction of the light. The direction information can reveal key information on how a nanostructured material emits and scatters the light. This information is key to tailoring a materials’ nanostructure to obtain the desired optical properties. It can also reveal details about:
- The performance of antenna structures
- The band structure of periodic systems
By placing colour filters in the optical beam path, researchers can isolate particular spectral features which is important as the angular profile can differ markedly for different emission wavelengths.
Polarisation Filtered Cathodoluminescence Imaging
Polarisation plays a key role in light -matter interactions and can be used to study coherence, scattering, birefringence, and chirality, for example. Additionally, it can be used to block spurious background radiation. When light is emitted from a nanomaterial the polarisation is not necessarily the same for every emission angle. Hence fully comprehensive polarisation studies need to be carried out in the Fourier -plane, i.e. angle-resolved mode. As the SPARC can perform angle resolved imaging it is ideal to also study polarisation effects.
The data shown in the figure shows the radial and azimuthal electric field amplitudes at different emission angles for a gold plasmonic bullseye grating, measured with CL polarimetry.

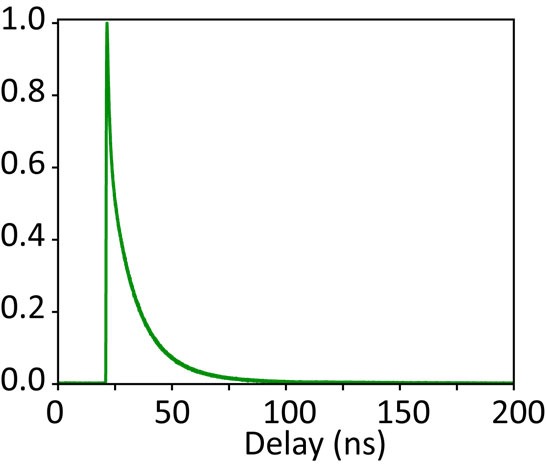
Time-Resolved Cathodoluminescence Imaging
By modifying the impinging electron beam from an SEM to deliver pulses (rather than a constant beam), researchers can probe the emission dynamics of a materials. The emission dynamics are directly related to the structure of the material. By correlating photon arrival histograms and secondary electron signals, time resolved CL becomes a powerful tool for characterising emission phenomena in light emitting materials and as well as probing the dynamics in photonic nanostructures with high spatial resolution.
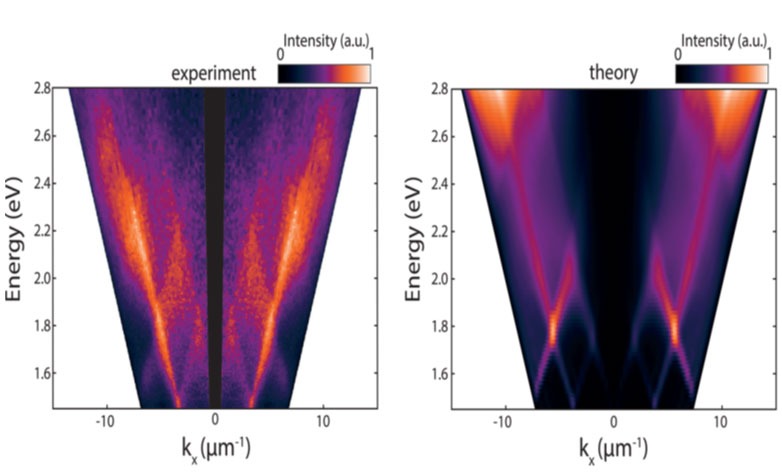
Energy-Momentum Imaging
In energy-momentum imaging angle-resolved imaging is combined with hyperspectral imaging to form a hybrid imaging method. One of the camera dimensions is used to measure a subset of momenta (angles) and the second is used to measure the spectrum yielding a 2D energy-momentum map. This method can be used to measure dispersion and directionality in photonic crystals, photonic topological insulator systems, gratings, and nanoantennas.
The DELMIC SPARC Platform
The DELMIC SPARC is a module that can be retrofitted to most existing SEM units, similar to adding other peripheral detectors. It is unique in that it can not only offer a range of measurement modes that that no other system can, but also through its design. The design incorporates a retractablemotorised micropositioning stage for parabolic mirror alignment which enables the user to take quantitative measurements with high collection efficiencies.
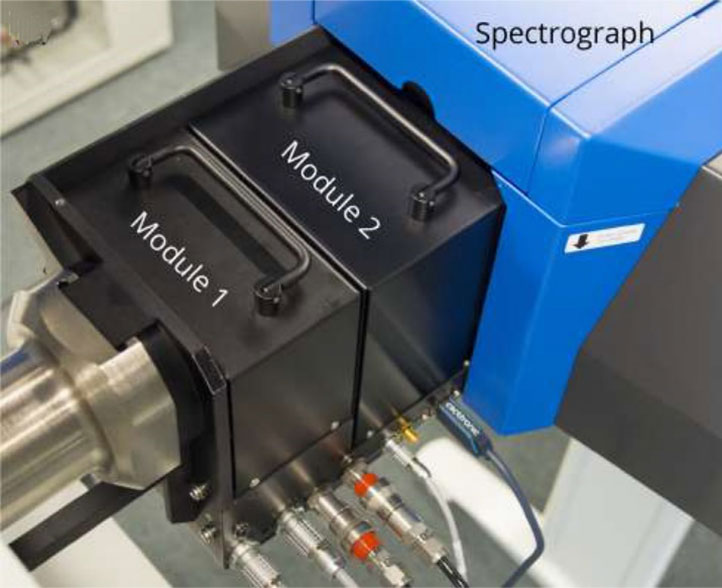
The SPARC CL system has a modular design. This enables the system to be configured for specific detection functionalities and wavelength ranges to suit the specific requirements of the researcher. The detector has two slots which can accept interchangeable optical modules.
References
[1] T. Coenen, E. J. R. Vesseur, and A. Polman, Appl. Phys. Lett. 99, 143103 (2011)
[2] C. I. Osorio, T. Coenen, B. J. M. Brenny, A. Polman, and A. F. Koenderink, ACS Photon. 3, 147 (2016)
[3] S. Mignuzzi, M. Mota, T. Coenen, Y. Li, A. P. Mihai, P. K. Petrov, R. F. M. Oulton, S. A. Maier, and R. Sapienza, ACS Photon. 5, 1381 (2018)

