
AttoMap
Micro XRF
The Most Advanced XRF Microscope Assembled for a Homelab

In crop sciences, genetic modification of crops to improve uptake of trace elements such as Cu, Fe, and Zn is a major focus of research, because it has direct implications for increasing micronutrient content and crop yield [1].
This work is critical for addressing problems in regions of the world with poor soil nutrition.
To determine the transportation mechanisms and signaling pathways to communicate demand for trace element uptake, it is necessary to localize such metals at the cellular level and at various growth stages of the plants. The AttoMap micro x-ray fl uorescence (microXRF) system provides the femtogram-level sensitivity and sub-cellular resolution needed.
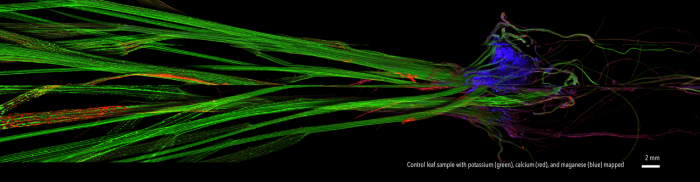
Turf Grass: Control Sample
Control root sample with potassium (green), calcium (red), and manganese (blue) shown
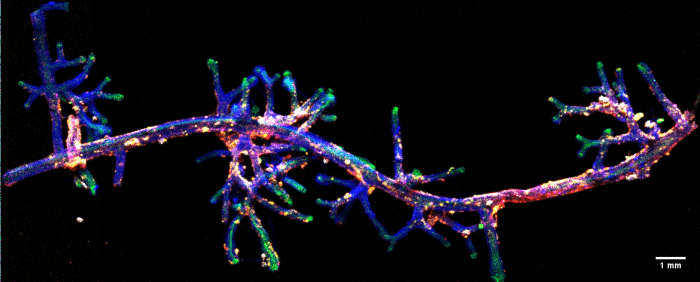
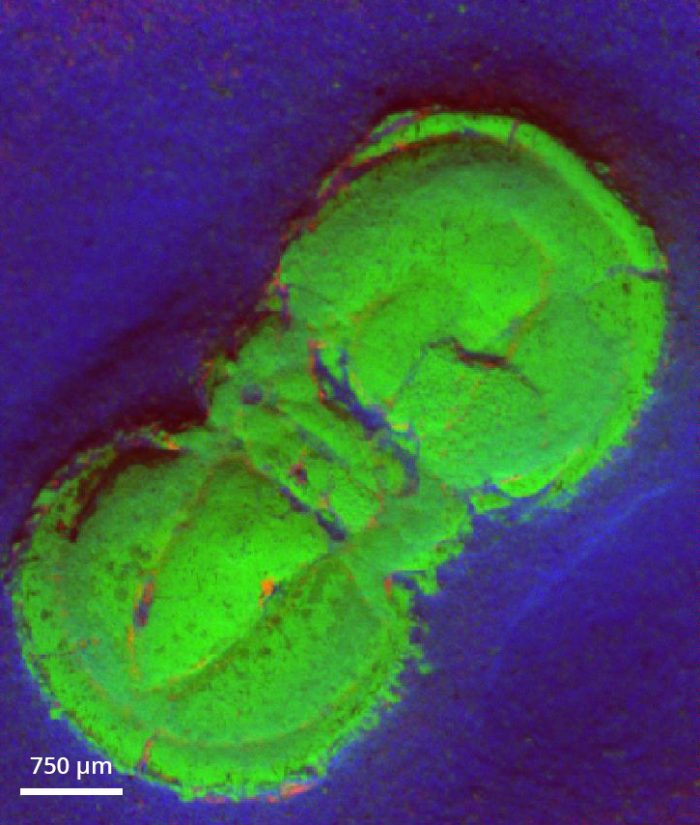
Metallic Contaminants in Plant Root
Elemental map of the Pinus halepensis root with symbiotic fungi. The colour of each element is: Ca (blue), Fe (red), K (green), Mn (magenta), Ti (yellow), Si (white) and Cr (cyan)
Saxifrage Leaf
Distribution of elements: Zn (blue), Fe (green), Ce (red)
Courtesy of Cerege, CNRS, AIX-Marseille University
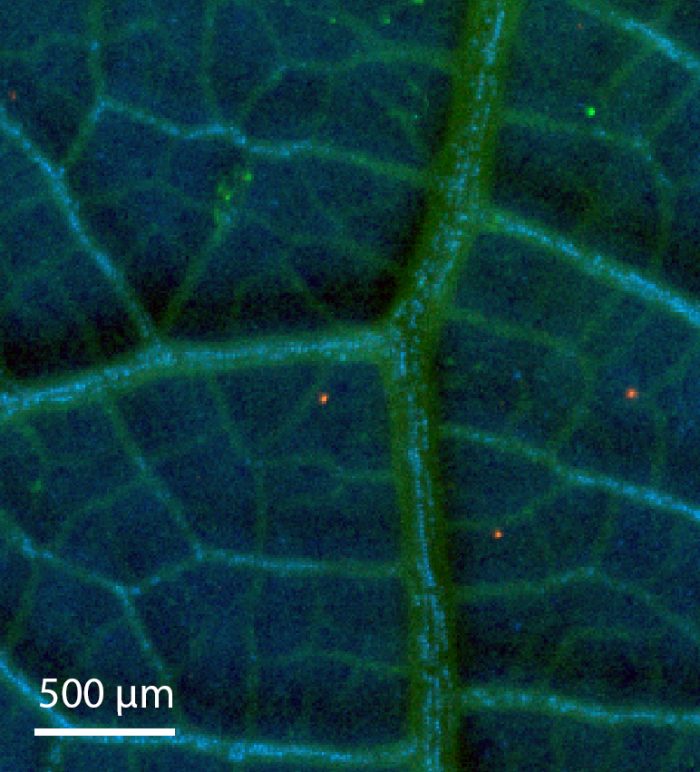
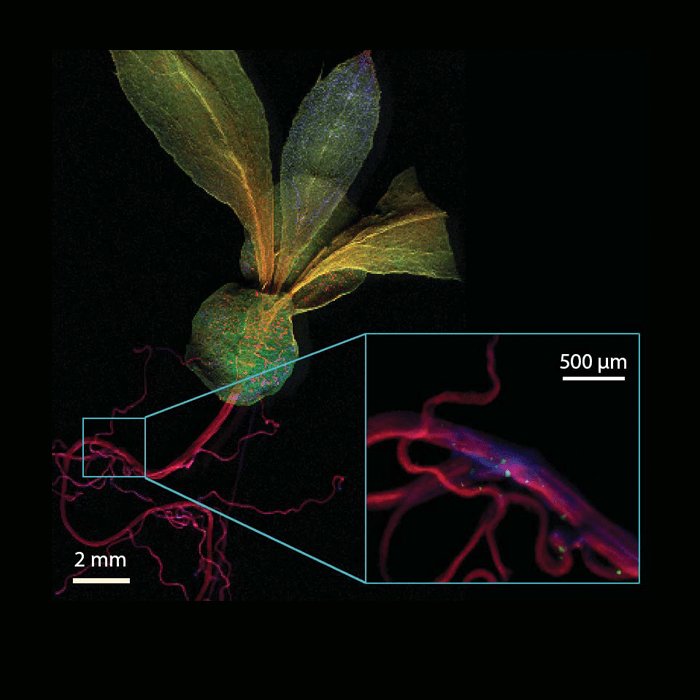
Hyperaccumulating Leaf
Leaf of a Maganese hyperaccumulating plant showing: backscattered low Z elements including carbon (green), Ca (blue), and Mn (red), with low levels of trace Mn detected.
Courtesy of Dr. Antony van der Ent and Dr. Peter Erskine, The University of Queensland, Australia
Trilobite
Trilobite showing Ca (green), K (blue), and Cl (red).
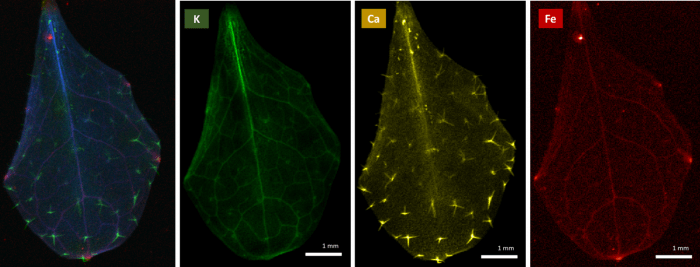
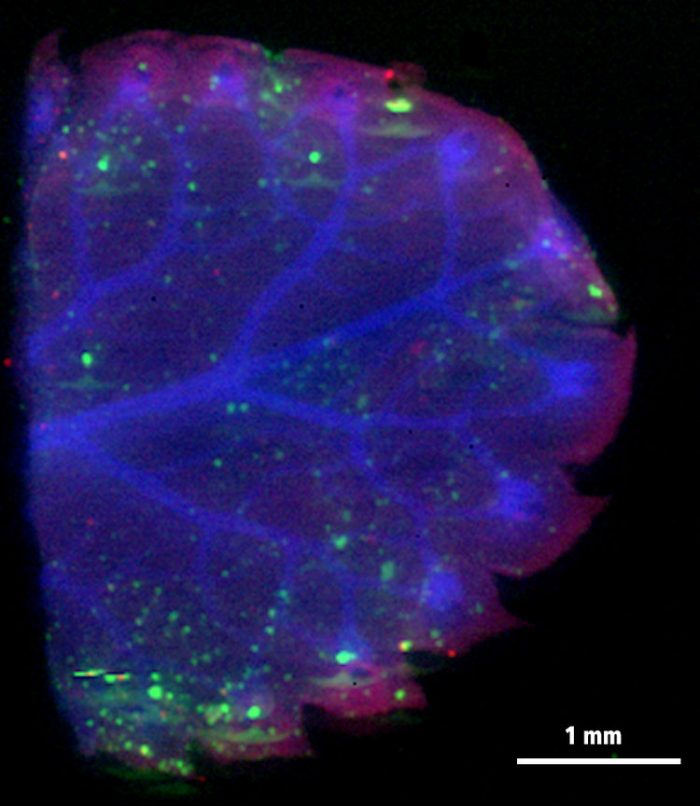
Mutant Arabidopsis
19-day leaf of a mutant OPT3 Arabidopsis plant, showing trace-level accumulation of iron (e.g. ug/cm^2)
Results comparable to previous runs on the synchrotron
Provided by Prof. Olena Vatamaniuk and Dr. Ju-Chen Chia, Cornell University