
Advanced materials with structures down to the nanoscale demand extremely sensitive and versatile characterisations techniques that can generate richer datasets at these such length scales. Time of Flight Secondary Ion Mass Spectrometry or ToF-SIMS is an excellent example.
ToF-SIMS vs Traditional Microanalysis Techniques
ToF-SIMS generates chemical analyses similar to more conventional techniques such as EDS and WDS (Energy Dispersive and Wavelength Dispersive Spectrometry), however, it has several advantages. While EDS/WDS are insensitive to light elements such as lithium, ToF-SIMS can detect and quantify all elements including hydrogen with a much higher accuracy. Furthermore, it can provide chemical state and molecular information, making it suitable for isotope and polymer identification and caters for all species with atomic masses in the range 0-10,000 amu.
It is also a highly surface sensitive technique compared to EDS/WDS. Taking measurements from the first few atomic layers ToF SIMS is a surface science tool that can be used for both bulk material and thin film characterisation. With detection limits in the ppm to ppb range it is suited to trace element detection. It’s high mass resolution (better than 0.00x amu accuracy) make it suitable for detecting ions (positive or negative), isotopes and molecular compounds (including polymers, organics compounds up to ~amino acids)
How ToF-SIMS Works
ToF-SIMS uses a pulsed particle beam, such as a Focussed Ion Beam (FIB) to ablate surface atoms. This produces dissociated ions or molecular compounds which are accelerated towards a detector. Their mass influences how long they fly before they reach the detector with lighter ones arriving before heavier ones. Their respective time-of-flight is proportional the square root of its mass. The detector is able to measure and quantify each particle that hits it, resulting in quantifiable compositional analysis for each point. By rastering the FIB, chemical maps of the surface can be generated with spatial resolution better than 100 nm. The FIB can also be used to mill surface layers to generate a 3D chemical map or depth profile which can reveal depth compositional variations of the material.
Applications of ToF-SIMS
ToF-SIMS has a wide-ranging relevance. While it has been used primarily for materials applications such as in coatings and thin films, polymers, semiconductors and catalysts. It is also ideal for research into Li-ion batteries where other X-ray-based techniques are unable to detect lithium due to it slow atomic weight. ToF-SIMs pertinence has been recognised in the fields of geology, pharmaceuticals and life science. In life science ToF-SIMS can be used to characterise molecular information from organic materials and tissue samples which are not possible with more common techniques such as EDS.
Case Study 1 – Oxygen Concentration in a CrN Coating
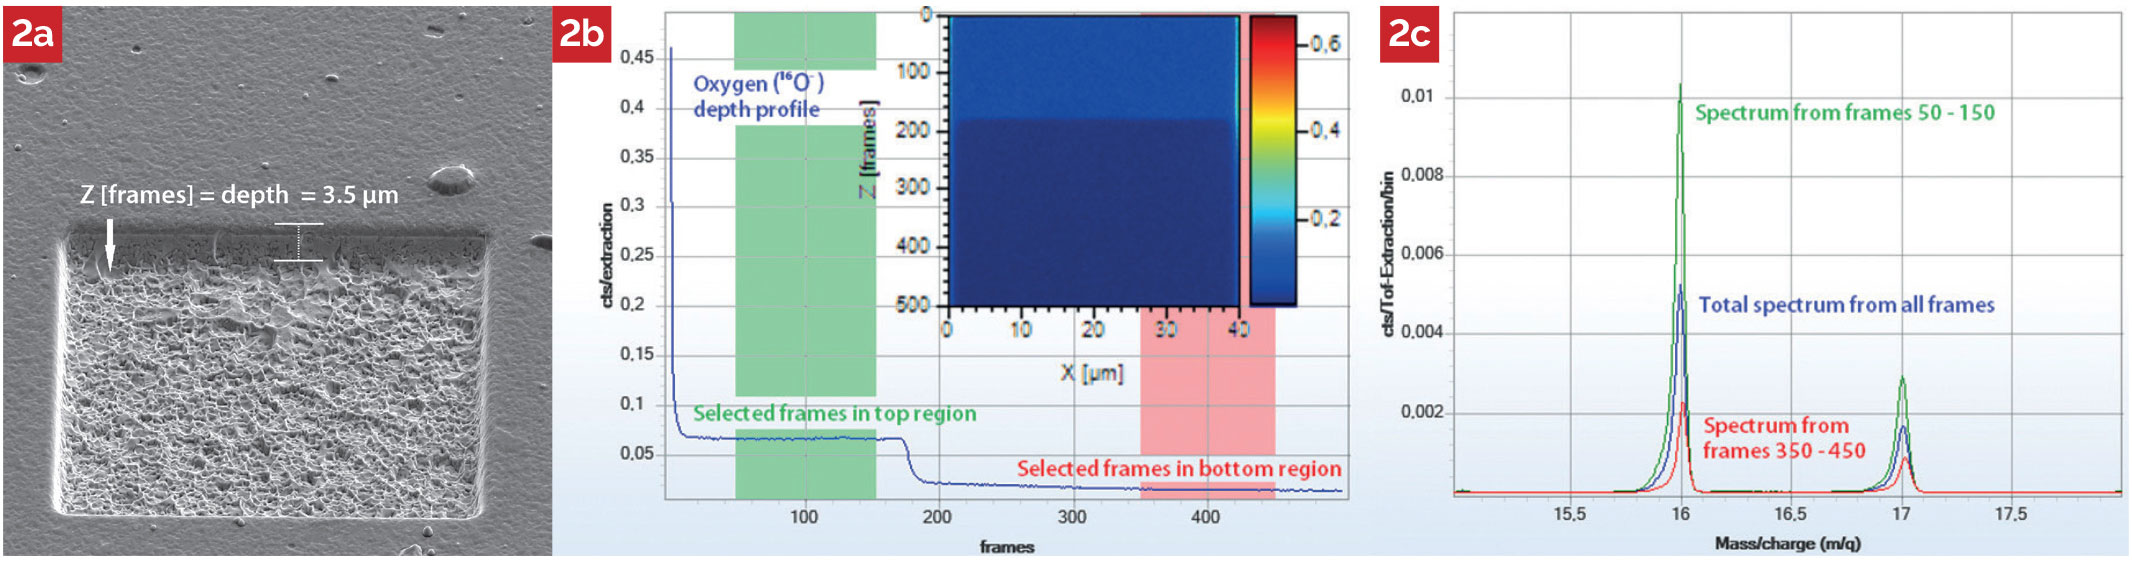
Chromium Nitride (CrN) is a coating often applied by PVD (Physical Vapour Deposition) to solve wear problems. In this example, the oxygen gradient in a CrN film on a WC-Co substrate was examined.
By taking measurements and then milling away the surface, depth profiles were generated. Figure 2b shows how the oxygen concentration varied as a function of depth. Since measurements are taken at every point, data can be integrated to give an overall spectrum, or spectra can be generated for specific regions, in this case top and bottom regions.
Case Study 2 – Chromium Concentration in Zircalloy
Zircalloy, as the name suggests are alloys consisting primarily of zirconium. They find application is in nuclear technology, as cladding of fuel rods in nuclear reactors.
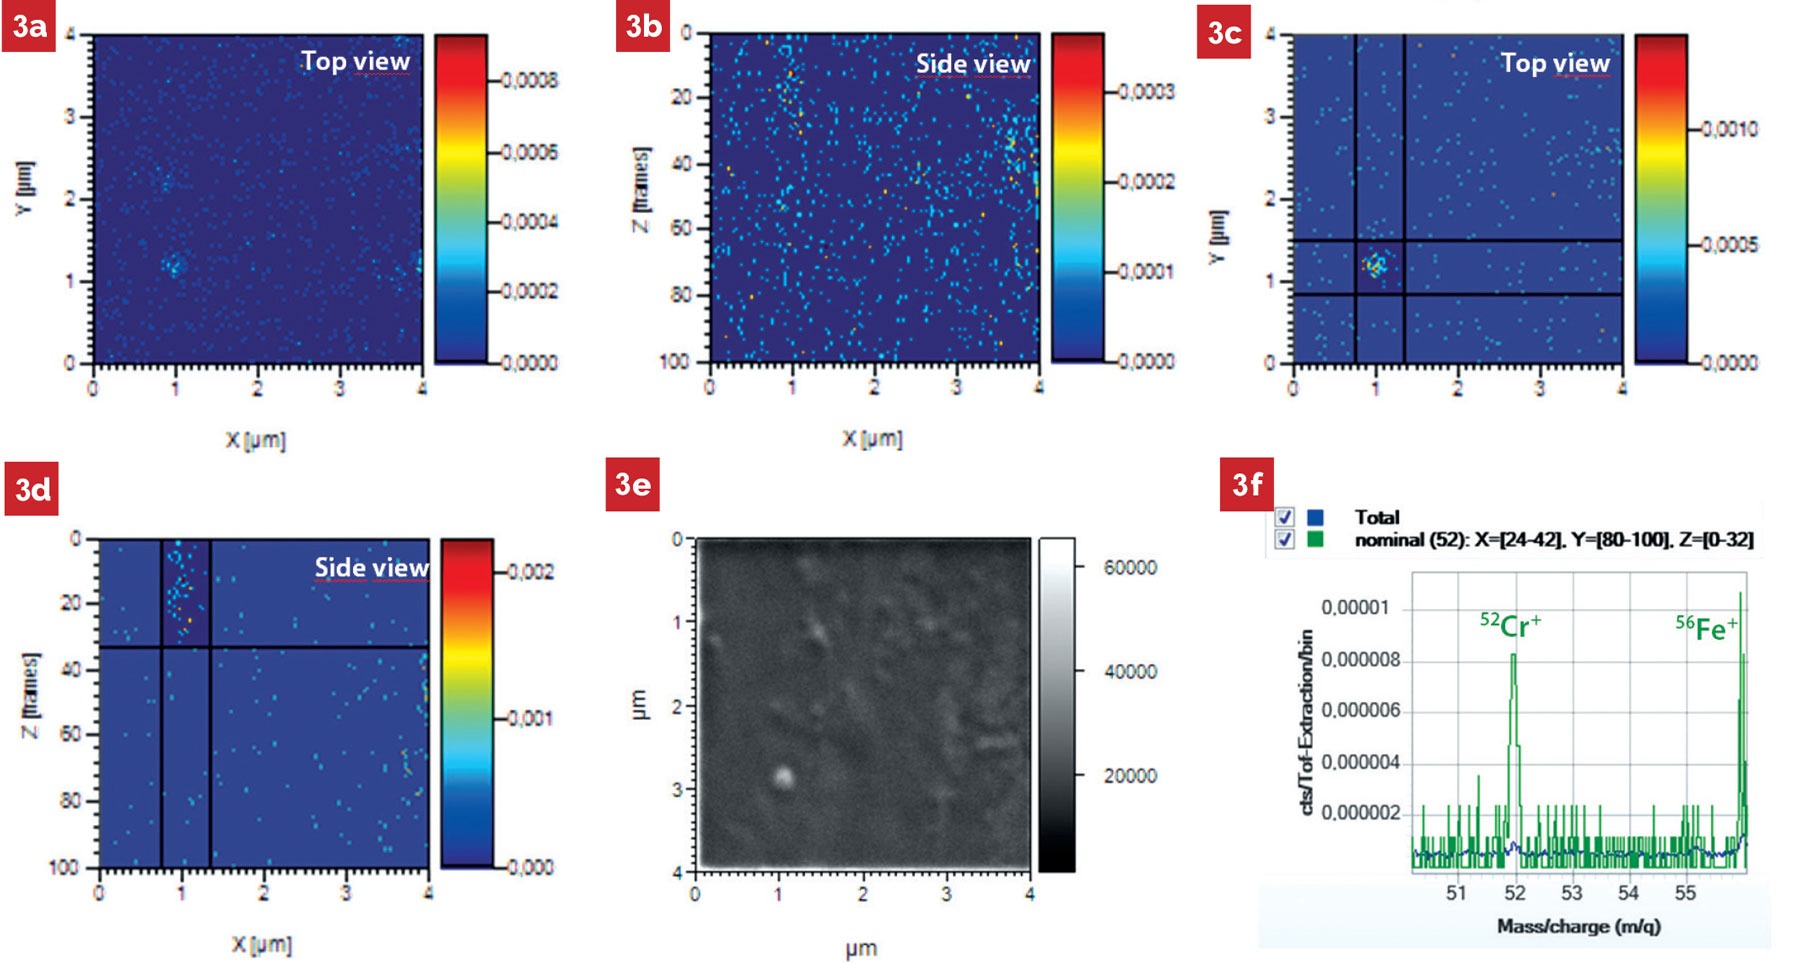
ToF-SIMS was used to map secondary Fe/Cr particles with dimensions down to 100nm in the zircalloy sample. Shown in figures 4a and 4b are integrated maps of the 52Cr+ isotope which is the most abundant, despite the low overall Cr content. When maps are integrated for only frames where a particle was located (figures 4c and 4d), the analysis becomes much clearer. Figure 4e shows the secondary electron image of the particle. This type of image can be captured simultaneously as each frame is anlaysed.
Figure 3f shows the spectrum from the particle (green) and is compared to the overall spectrum for the total volume analysed (blue).
Case Study 3 – Lithium in Elbaite
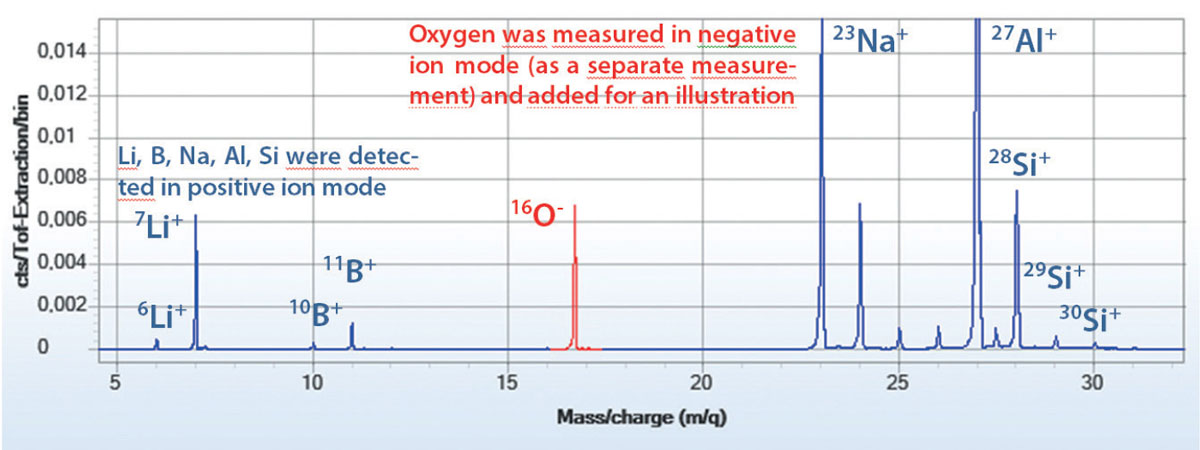
Elbaite, a sodium, lithium, aluminium borosilicate mineral, with the chemical composition NaAl₆Si₆O₁₈(BO₃)₃(OH)₄. Its chemical composition can’t be accurately determined using X-ray techniques such as EDS/WDS or even XRF as lithium is too light to be detected. ToF-SIMS on the other had is able to detected both lithium isotopes. The resultant spectrum for Elbaite is provided in figure 4.
Summary
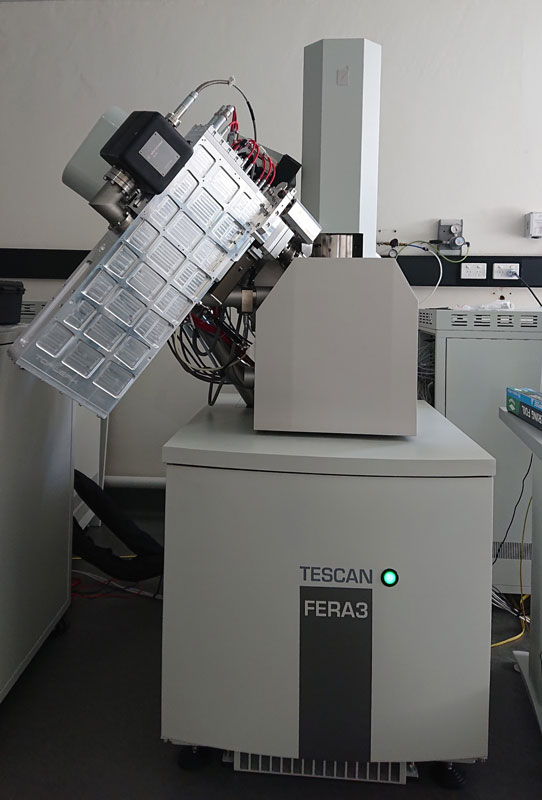
ToF-SIMS provides numerous advantages over more traditional microanalytical techniques such as EDS and WDS including higher sensitivity and better resolution as well as the ability to detect light elements which is not possible using X-ray based methods. It has been integrated into generation 3 TESCAN FIB-SEMS such as the LYRA and FERA and more recently generation 4 systems like the AMBER X where it provides next generation chemical analysis at the nanoscale.